Monitoring Water Levels in the Asheville Metro Area
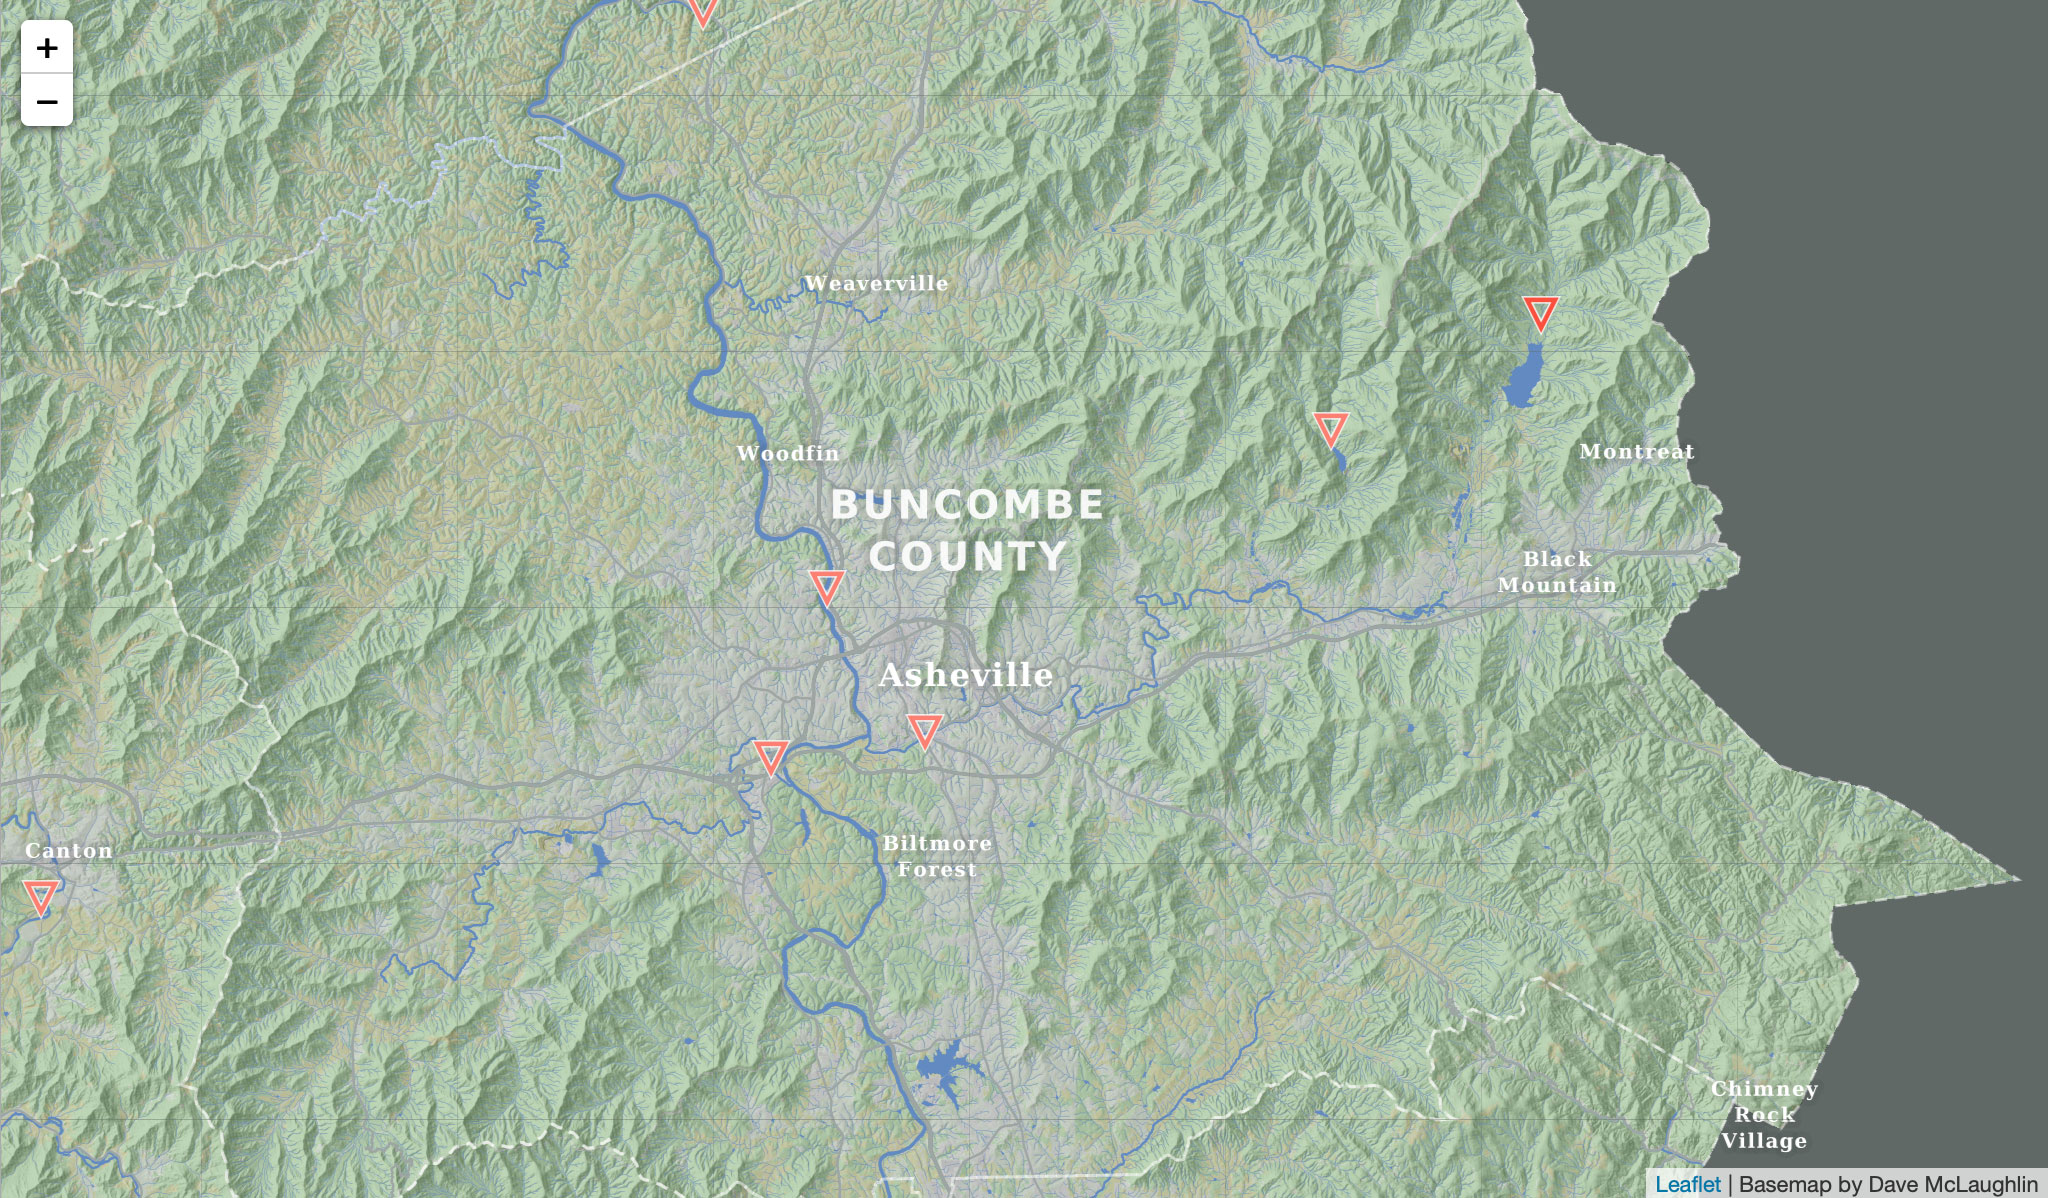
For an open web mapping graduate course, I created an interactive map for Monitoring Water Levels in the Asheville Metro Area.
I created the custom basemap from scratch in QGIS, using data obtained through the USDA Natural Resources Conservation Service data gateway. I then pre-baked all the tiles using TileMill and use Leaflet to display the interactive map.
The feature layers (water level gauges) are hand-crafted, artisanal GeoJSON files. Clicking on a water gauge point on the map will then go make an API request to the USGS Water Service to retrieve live data on the water level at that point, which I then chart using D3.