Mapping Forest Canopy Cover by Watershed
For a conservation GIS grad course, I created an interactive map displaying forest canopy cover statistics by watershed for the Susquehanna River.
I was hoping to dynamically calculate the statistics on the fly using Esri’s ArcGIS API for Javascript, but it looks like the ability to perform some of the necessary raster functions was removed from the latest major version of the API. It looks like Esri is pushing folks to use the ArcGIS Server product instead and perform the calculations on the server, not in the client.
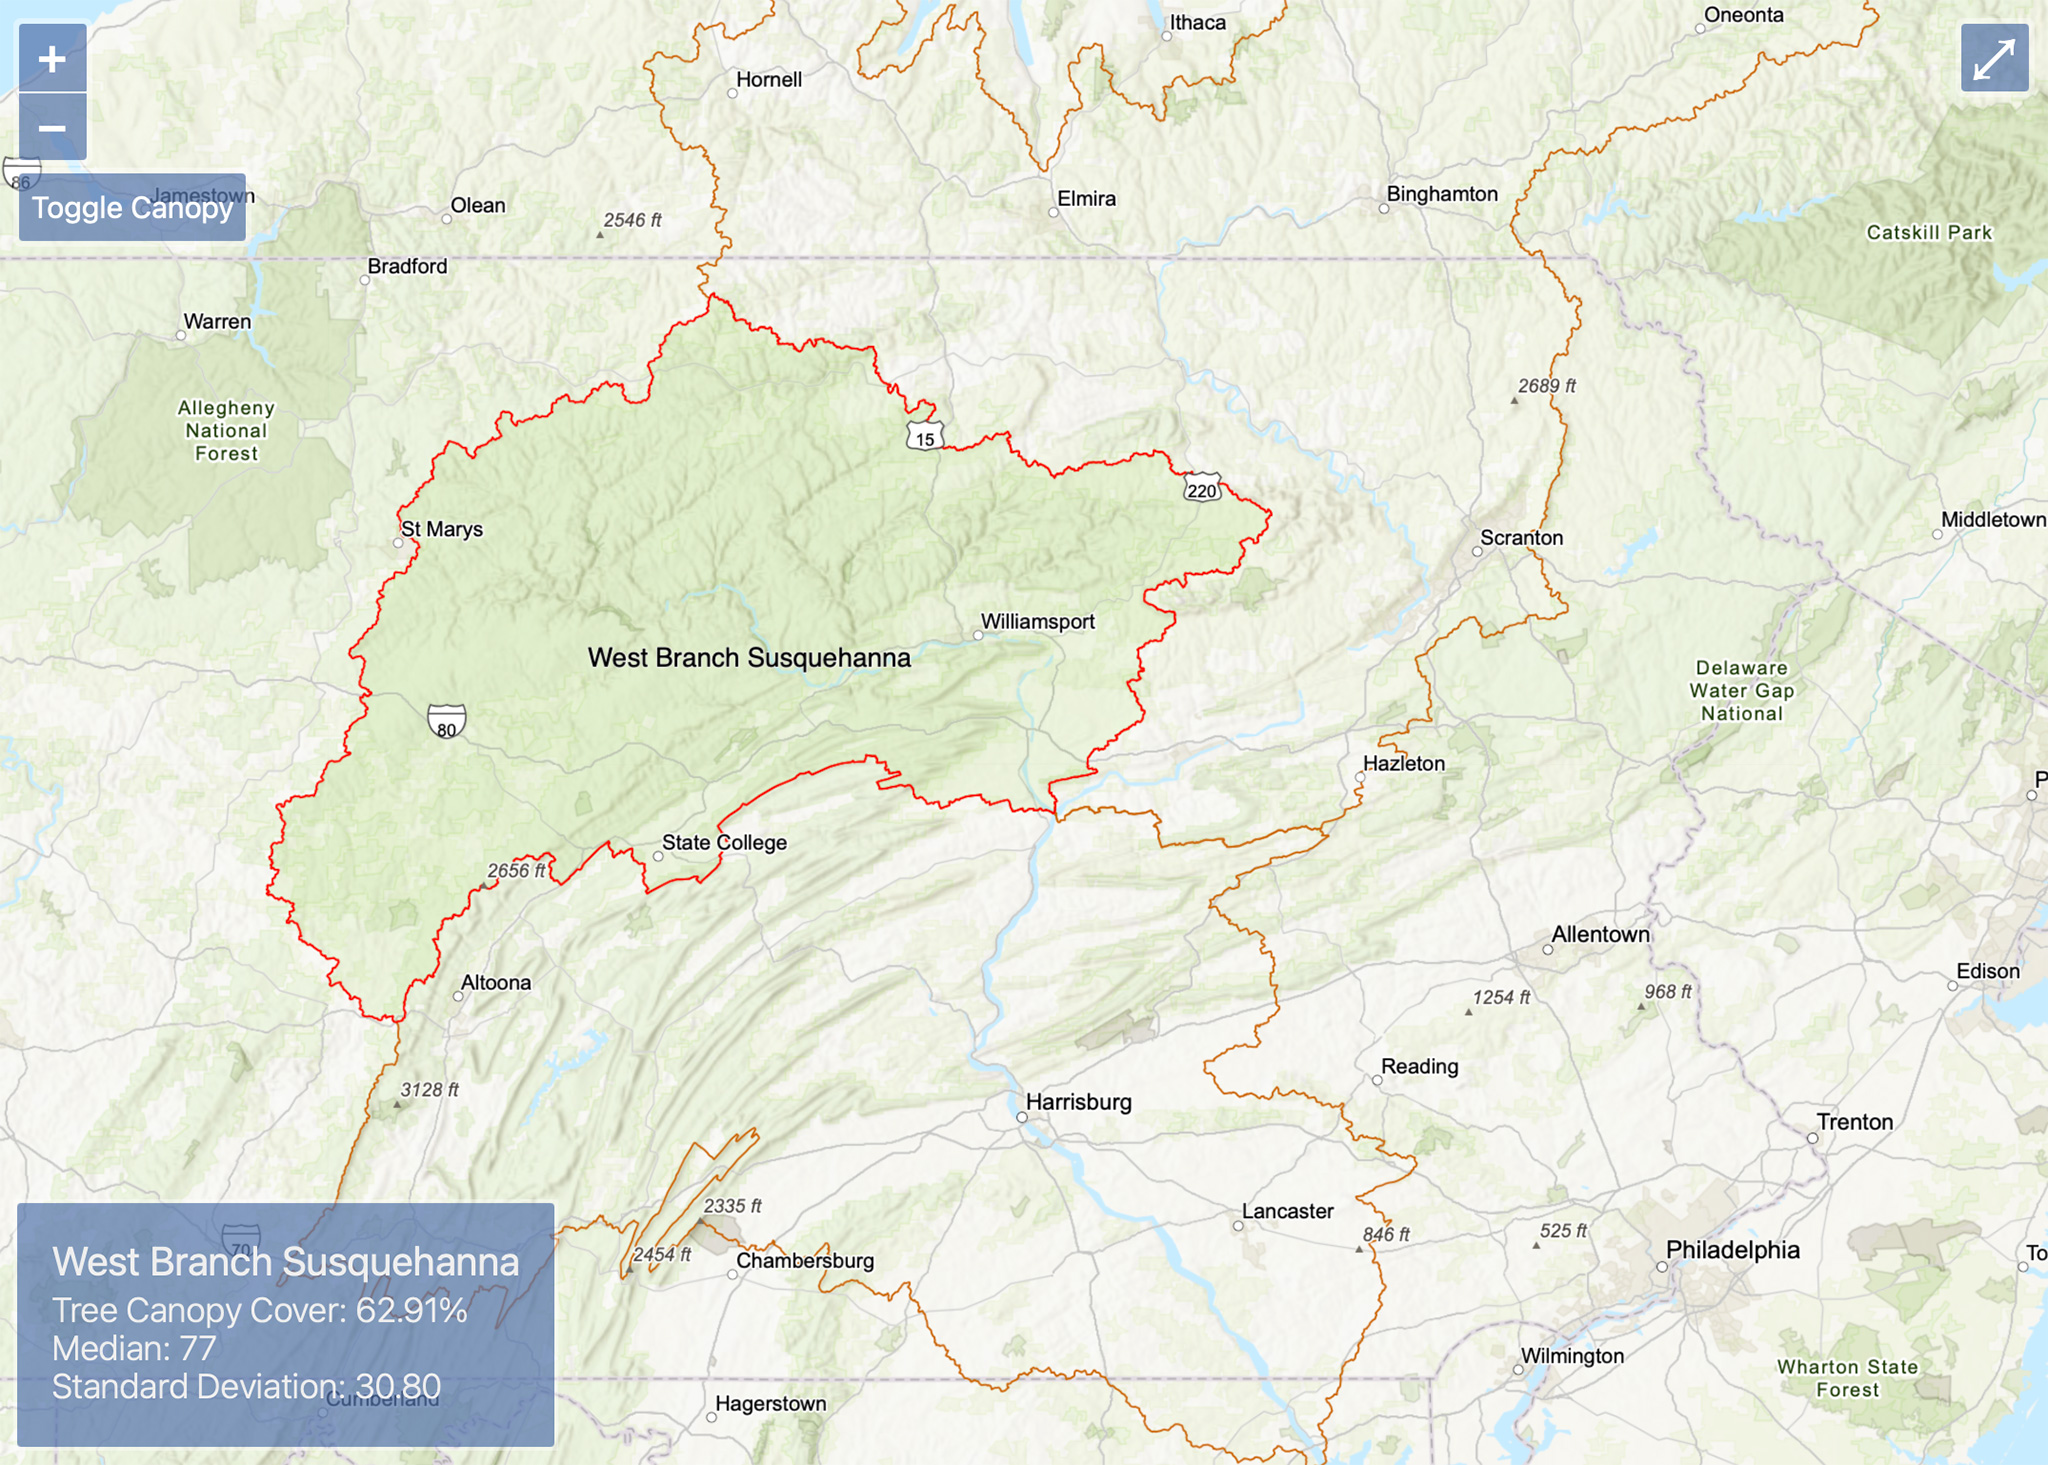
Instead, I pre-calculated the statistics in ArcGIS Pro and manipulated my files in QGIS and Mapshaper (to deal with the right-hand rule!). The map is built with OpenLayers and loads with an Esri basemap and hillshade. The user can toggle the USFS Tree Canopy Cover layer, which loads in from the MRLC Consortium. The watershed boundary polygons and statistics are loaded as static GeoJSON files. Zooming in and out and hovering over the watersheds at various levels provides statistics on the forest canopy cover.